Debug Backfilling Historical Data into Prometheus
Prometheus provides a method
to backfill historical data, but the process is not very smooth. I describe the gotchas that I stumbled upon and
how I debug inserting historical data into Prometheus.
My setup
I use Prometheus with Grafana for my small telegram bot. Since the app doesn't provide a REST API, I decided that
introducing a REST server just for Prometheus to scrape metrics would be an overkill, so I also use pushgateway to
push data into Prometheus. All of these services run in Docker.
Take note of prometheus_data volume here, we will use it later.
Prometheus Support for Backfilling Data
There is
a documentation on how to import historical data into Prometheus from OpenMetrics format. I searched online, and
it looks like there were plans to support other ways to backfill historical data: see
here
and
here. But as of writing this
in April 2026, the only way in documentation is creating a new TSDB blocks from OpenMetrics format and restart
Prometheus.
Preparing OpenMetrics file
OpenMetrics file needs to be of a strict formet: one metric per line, no empty lines,
# EOF at the end
of the file. Pay attention to make sure you included all the metric labels needed!
Here's my example of OpenMetrics files I ended up with.
Some common format issues
Error message getting min and max timestamp: next: expected next entry after timestamp, got " 1776110190" ("EOF") while parsing: ...
usually means you miss # EOF at the end of your file.
Error message getting min and max timestamp: next: expected a valid start token, got "\n" ("INVALID") while parsing: "\n"
means you have an empty line.
Generating new blocks
After running
promtool tsdb create-blocks-from openmetrics /<input-file>/ [<output-directory>/],
you should see new blocks created:
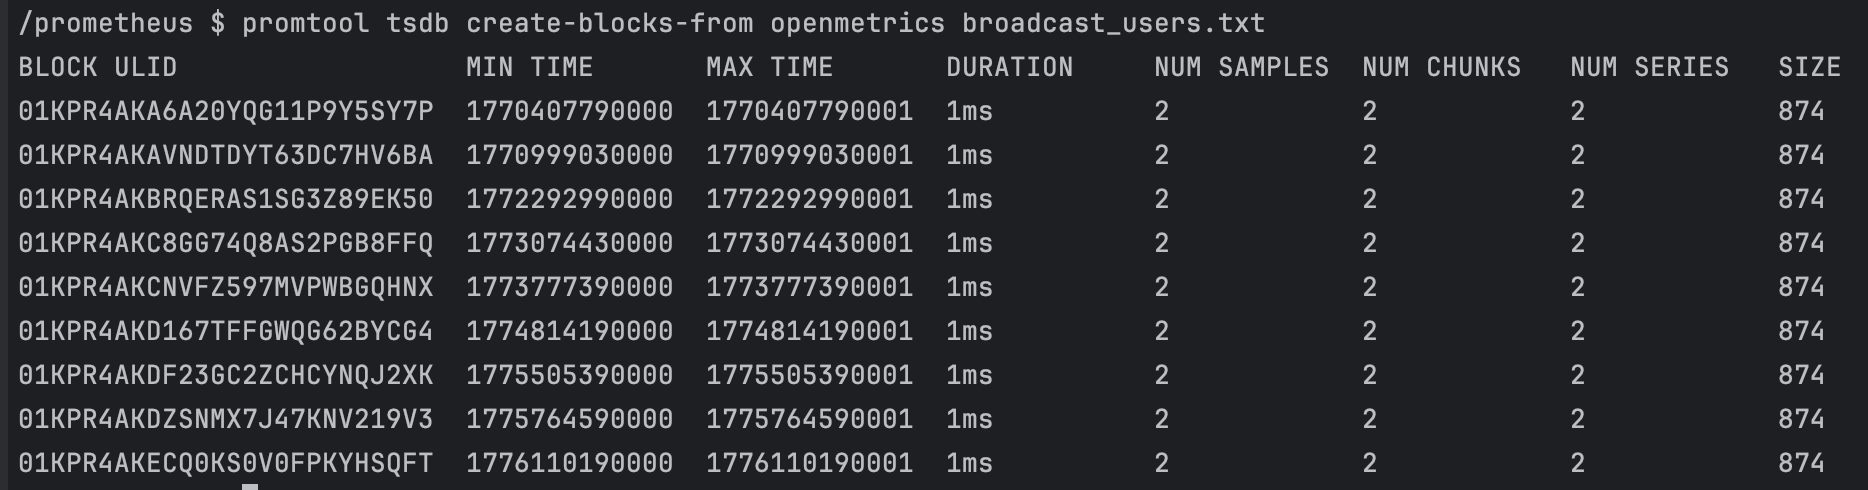
Note: if you don't provide
output-directory, the blocks will be created in a new directory called
data.
Make sure to move them into your
prometheus_data directory and restart Prometheus:
docker restart prometheus.
Verifying that the data is there
Check the Prometheus logs after restart:
docker logs prometheus. You should see a messages like
time=2026-04-21T13:54:45.758Z level=INFO source=repair.go:54 msg="Found healthy block" component=tsdb mint=1770999030000 maxt=1772292990001 ulid=01KPR543K3XKHMBXSQPYT1DR6A
for every new block. If the messages are now there, make sure that the blocks are in the correct directory.
If you don't see your inserted data in Grafana, it doesn't mean that it's not in Prometheus! Different Grafana
settings, like
min step may affect how your data is displayed, especially if you inserted scattered data.
Check in Prometheus tool (usually your port 9090) by name of the metrics and timestamp, like this:
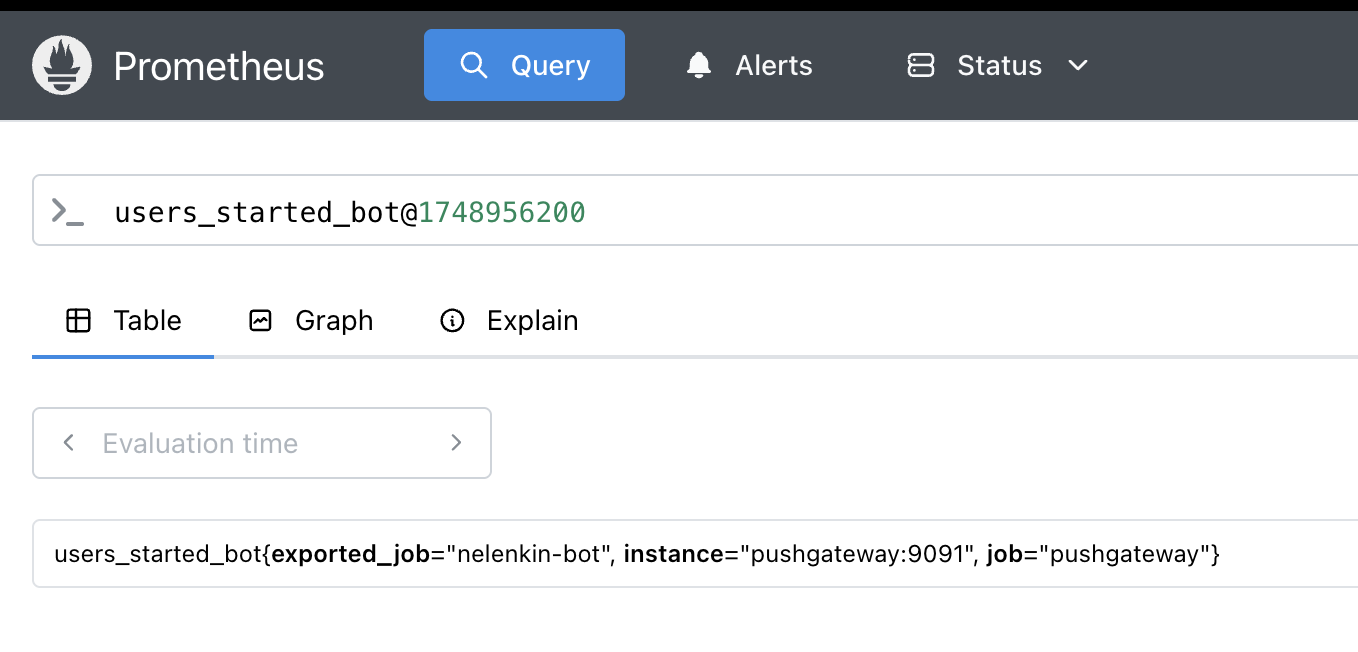
If your data is there, success! Then you can play around with setting in Grafana to make your data visible if you need it.
Changing Prometheus Retention
Prometheus will delete data that is older than specified in retention policy. If you want to change your retention
policy, you have to specify it in your command that starts Prometheus (not prometheus.yml file).
Be careful, passing "--storage.tsdb.retention.time" in docker-compose command will override the whole
command, not append just one flag. So you have to get the command that currently starts you prometheus
cat /proc/1/cmdlineand move all this args into docker-compose file as well! Here's the docker service
for prometheus I ended up with.